Ashley Cyriaque
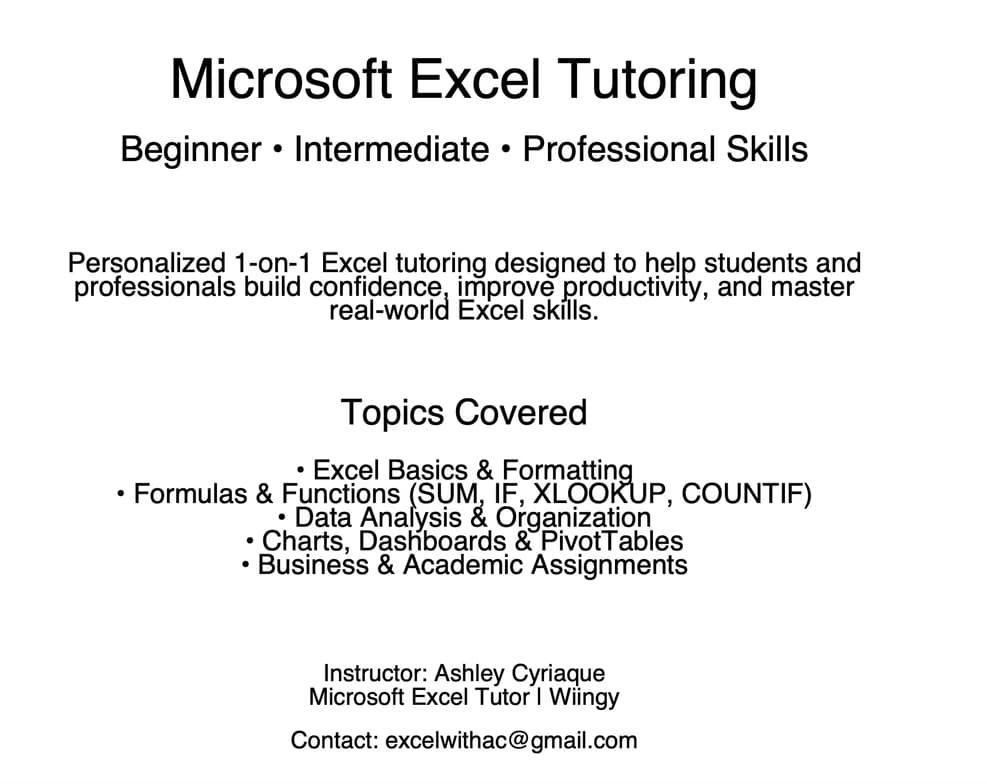
Learn Microsoft Excel with Me: Practical Skills for Beginners, Students, and Professionals
Loading...


Show all photos
Ashley Cyriaque
Diploma degree
Enroll after the free trial
Each lesson is 55 min
50 lessons
20% off
/ lesson
30 lessons
15% off
/ lesson
20 lessons
10% off
/ lesson
10 lessons
5% off
/ lesson
5 lessons
-
/ lesson
1 lessons
-
/ lesson
About your data science tutor
Hi, I’m Ashley Cyriaque, a Microsoft Excel tutor with over 7 years of experience helping students and working professionals build confidence and practical skills using Microsoft Office. I am certified in Microsoft Excel, Word, and PowerPoint, and I specialize in teaching Excel in a clear, structured, and approachable way. My goal is to help learners not only understand Excel, but feel comfortable and confident using it independently. My tutoring focuses on real-world Excel skills, including formulas and functions, data organization, charts, dashboards, PivotTables, and basic data analysis. I work with beginners who are new to Excel, students who need help with assignments or projects, and professionals who want to improve productivity, accuracy, and efficiency in their roles. I tailor every session to the learner’s goals, experience level, and pace, ensuring each lesson is practical and immediately useful. My teaching style is patient, supportive, and hands-on. I believe Excel doesn’t have to feel overwhelming, and I break down complex concepts into simple, step-by-step instructions. I create a comfortable learning environment where students feel encouraged to ask questions and build confidence. Whether you’re preparing for school, improving workplace skills, or learning Excel for personal growth, I’m here to support you every step of the way.
Ashley graduated from M

Data Science tutor skills
Data visualization
Statistical analysis
Business intelligence
Assignment help
Learner types for data science class
Data Science for beginners
Data Science for adults
Data Science for kids
Data Science for intermediate
Data Science for advanced
Data sciece class overview
My teaching methodology is focused on clarity, confidence, and real-world application. With over 7 years of experience and certifications in Microsoft Excel, Word, and PowerPoint, I understand that each student learns differently. I begin by identifying the learner’s goal (school assignments, workplace productivity, or building general Excel skills) and assessing their current level. From there, I tailor each lesson to match their pace and learning style. I use a hands-on approach because Excel is best learned by doing. During sessions, I share my screen and guide students step-by-step, then have them practice independently while I provide feedback and support. I explain not only how to complete a task, but also why it works, so students develop true understanding instead of memorizing steps. I also focus on practical examples such as budgeting, tracking, reports, and real spreadsheets students may use at work or in school. Each lesson follows a structured flow: quick review, new concept, guided practice, and independent practice. I break complex topics (formulas, functions, charts, PivotTables, and data organization) into smaller steps to prevent overwhelm and build confidence. I encourage questions throughout and create a supportive environment where learners feel comfortable making mistakes and improving. When helpful, I provide optional practice activities and tips between sessions so students can reinforce skills and stay consistent. My goal is for students to become confident, independent Excel users who can apply what they learn immediately in school, at work, or in personal projects.
Flexible Scheduling
Allows 1h early scheduling
Allows 1h early rescheduling
Can wait for 20 mins after joining

10 day Refund
Free Tutor Swap

Data Science concepts taught by Ashley
The Student and Tutor reviewed advanced Excel functions, specifically the `GETPIVOTDATA` function, its application in building dashboards, and the structure of Excel formulas. They practiced retrieving specific data points from pivot tables and discussed building automated workflows. The homework assignment involves creating a cleaner dashboard with KPIs broken down by cleaner name and service type, utilizing `GETPIVOTDATA` formulas.
Calculating Average Revenue Per Job
Dynamic Date Updates with the `TODAY()` Formula
The `GETPIVOTDATA` Function: Extracting Specific Information from Pivot Tables
Data Flow and Dependencies in Excel Dashboards
The Tutor introduced the student to the basics of Microsoft Excel, covering its core components like workbooks, worksheets, rows, columns, and cells, as well as an overview of the Excel interface, including the ribbon and its various tabs. The session included practical exercises on renaming worksheets, formatting text, and navigating cells, with plans for future sessions to delve deeper into functions and homework assignments to reinforce learning.
Cells
Rows
and Columns
Excel Workbook vs. Worksheet
Basic Data Manipulation
The Excel Ribbon
Formatting Cells
The student and tutor worked on building and refining interactive dashboards in Excel. They practiced creating pivot tables, charts, KPIs, and slicers to visualize data dynamically. The session concluded with instructions on worksheet protection and an assignment to create a cleaner's dashboard as homework.
Pivot Tables and Charts for Dashboards
Protecting Your Dashboard
Dashboard Design Principles
Slicers and Report Connections
The student and tutor worked through advanced Excel functions, specifically focusing on data organization and analysis. They practiced sorting and filtering data for better comprehension and explored the creation and application of pivot tables for summarizing datasets. The next session is planned for Tuesday at 10 AM, and the tutor will provide notes.
Sorting Data
Filtering Data
Pivot Tables
Data Visualization: Charts & Graphs
The student and tutor reviewed and practiced creating pivot tables and various chart types (column, bar, line) based on provided data. They discussed best practices for chart interpretation and began exploring the creation of interactive dashboards using these elements, with the student assigned to build specific pivot tables and charts for a practice dashboard as homework.
Pivot Tables and Charts Fundamentals
Dashboard Creation: Interactive Data Visualization
Chart Types and Their Applications
The tutor taught the student how to use conditional formatting in Excel to highlight data based on text and numerical rules. They practiced applying these rules to sales data and explored advanced techniques like using formulas. The student was assigned homework focusing on conditional formatting, if statements, and pivot tables, with plans to cover macros and automation in future sessions.
Conditional Formatting in Excel
Excel Formula IF Statement
Creating Charts from Pivot Tables
Teaching tools used by data science tutor
Looker
Interactive data science classes
Record lessons
Chat for quick help
Note taking
Parent feedback
Open Q&A

Data Science tutors on Wiingy are vetted for quality
Every tutor is interviewed and selected for subject expertise and teaching skill.